How to install Elasticsearch, Kibana and WinLogBeat in your CloudLab the lazy way

Overview
In this post I will guide you through the installation of Elasticsearch, Kibana and Winlogbeat. We will walk through each step on Amazon Linux 2 (but the concept is similar for other Linux distributions).
In part 2 we will see how we can use the System as a Security Information and Event Management System (SIEM). A SIEM collects logs from the machines in the network. It also provides a queryable interface that the Blue Team uses to detect cyber attacks.
The easy way
The easiest option to see it in action is to clone the template I created on snaplabs (https://www.snaplabs.io).
For that you create an account on snaplabs, login and you are then greeted with the following page.
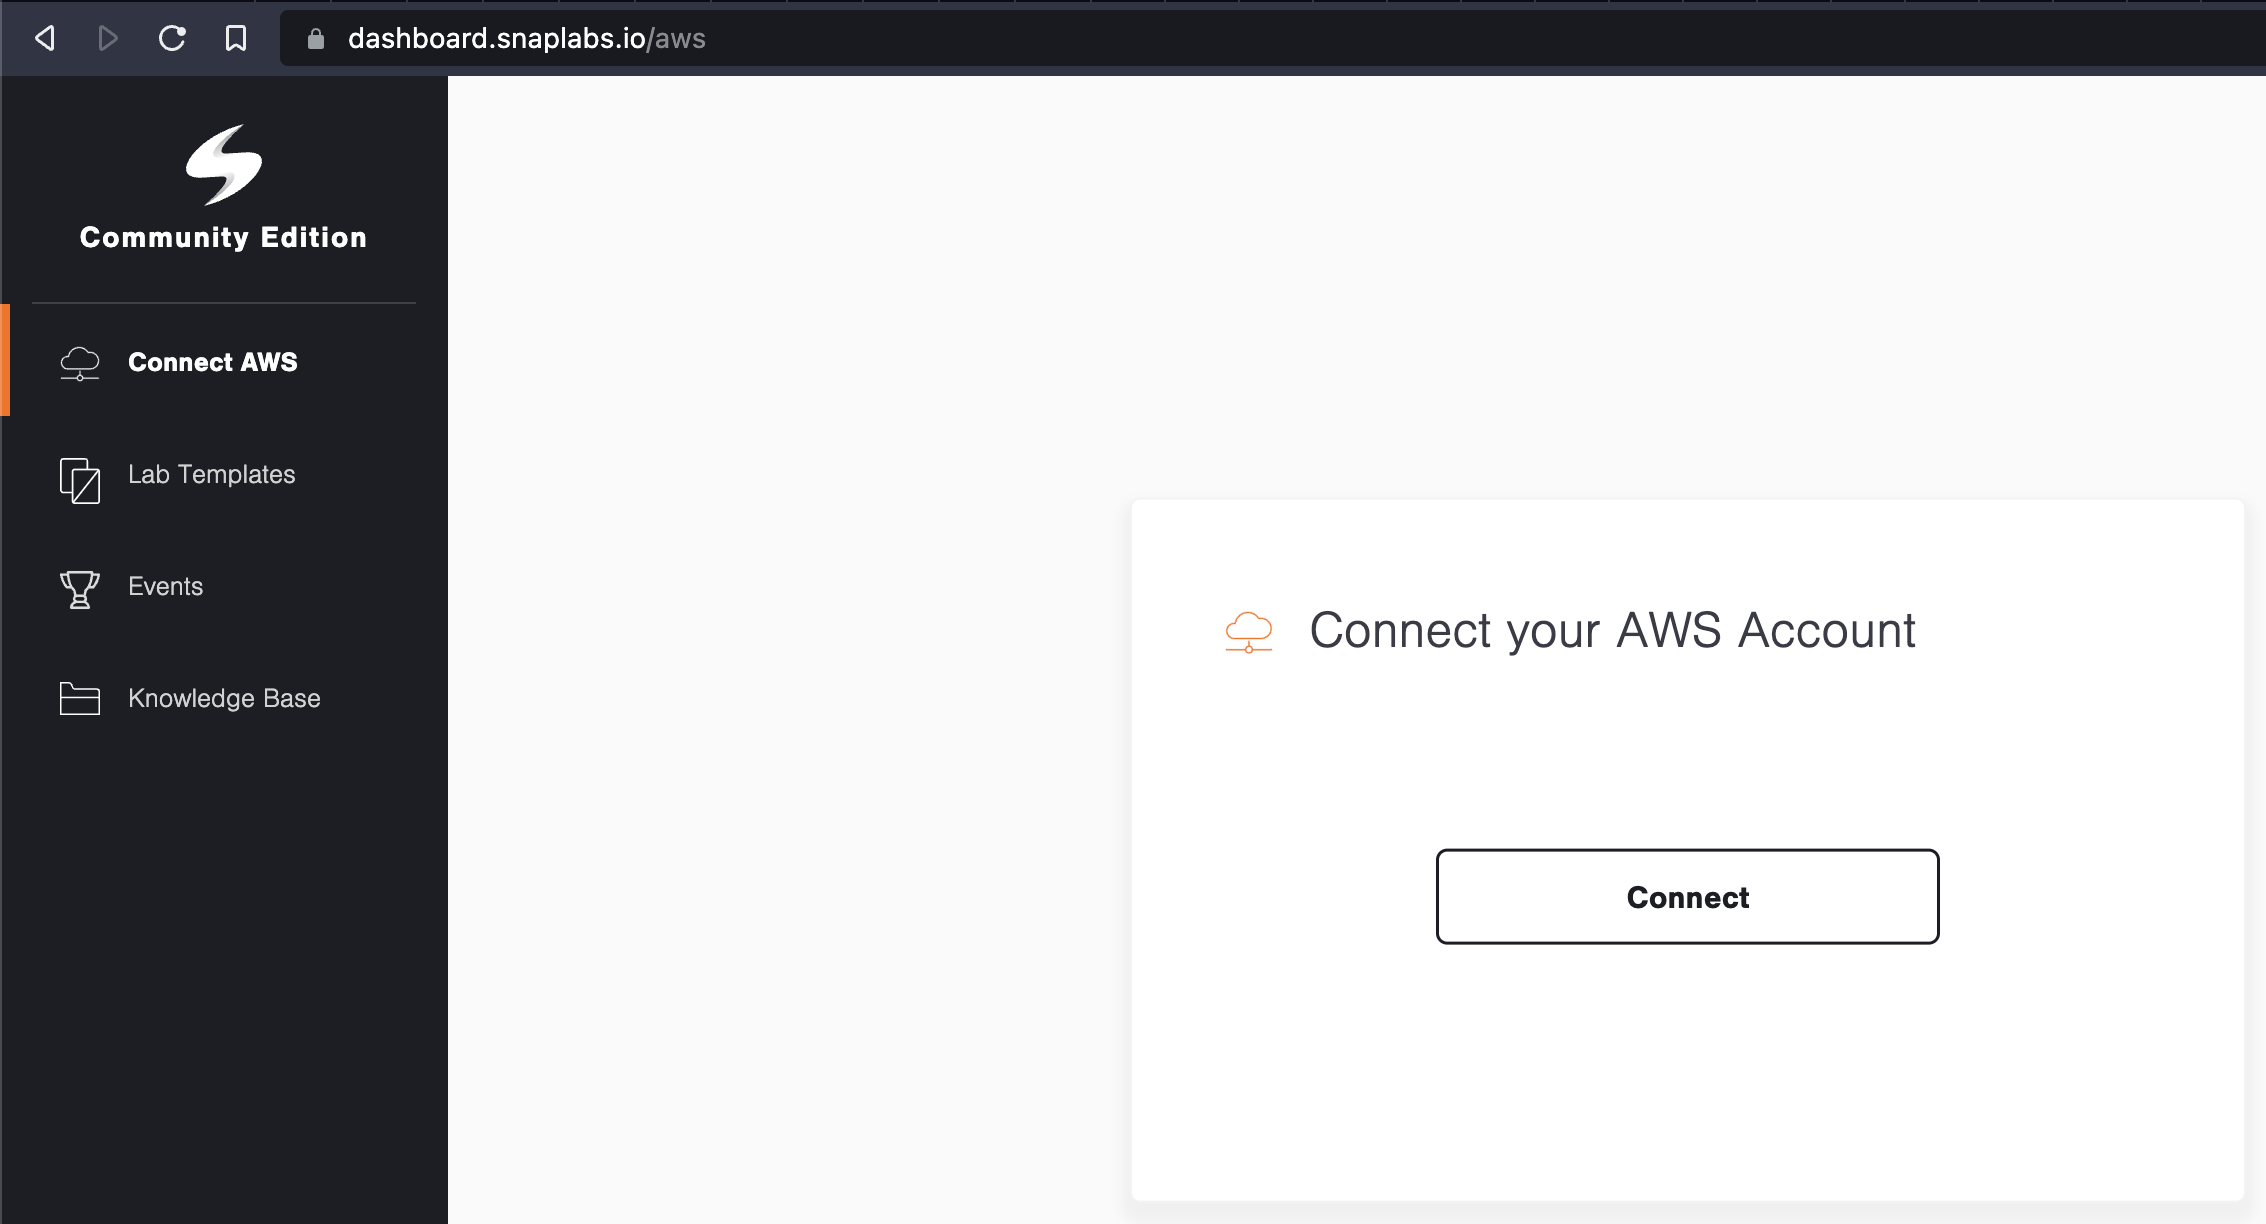
Snaplabs works with Amazon Web Services (AWS). To use it you need to connect your AWS account by clicking the big button in the middle of the page. One cool thing about snaplabs! The machines will be shutdown after 2h automatically. No more expensive surprise cloud bills! Plus, you can change the time limit as well.
Once you have connected your AWS account you can clone the template by visiting the following url: https://dashboard.snaplabs.io/launch/0e5b712f-4acc-432f-5204-3ff9711ca029
DISCLAIMER
Make sure to not use this in any production environment. This is HomeLab stuff only, because you don't have any authentication and no encrypted traffic - SERIOUSLY BAD JUJU. OK, on we go!
Step 0
Start the machine/cloud instance that you want to run Elasticsearch on. We will use AWS EC2 and 8GB RAM and 40GB of disk space. Why!? Because we want to run Elasticsearch and Kibana on the same machine. You would not do this in production environments! You would split the Services onto their separate instances for scalability and redundance.
Step 1
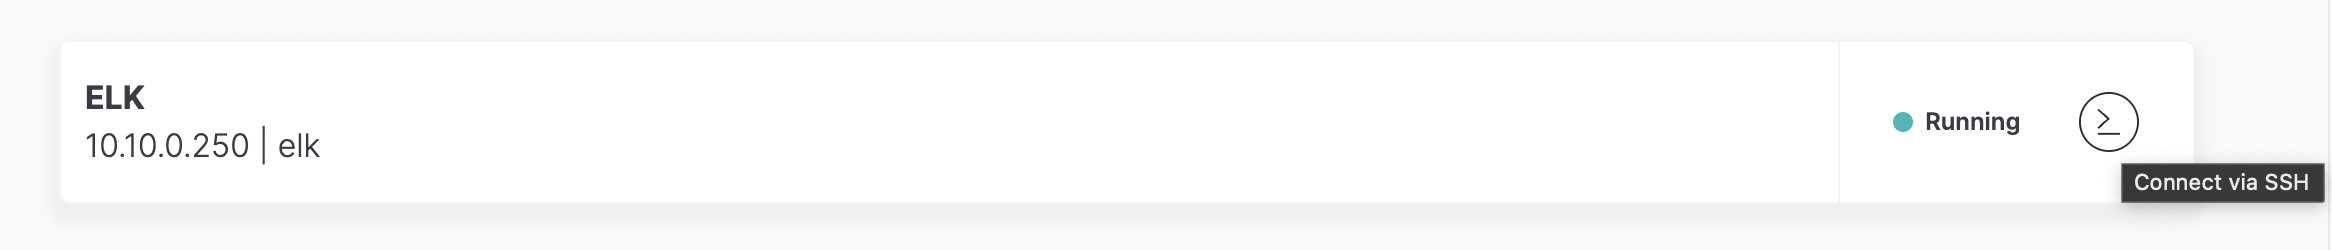
Connect to the machine via ssh or guacamole.
next we install java
Since the Elastic stack runs on java we need a JDK and openjdk is our choice here.
sudo yum -y install java-openjdk java-openjdk-devel
Step 3
Now we need to add the corresponding repositories with:
cat <<EOF | sudo tee /etc/yum.repos.d/elasticsearch.repo
[elasticsearch-8.x]
name=Elasticsearch repository for 8.x packages
baseurl=https://artifacts.elastic.co/packages/8.x/yum
gpgcheck=1
gpgkey=https://artifacts.elastic.co/GPG-KEY-elasticsearch
enabled=1
autorefresh=1
type=rpm-md
EOF
Press enter once more and you should have created the correct file.
Step 4 - import the gpg encryption key
sudo rpm --import https://artifacts.elastic.co/GPG-KEY-elasticsearch
Step 5 - clean and update the system cache
Now we clean the system cache and update it afterwards. This makes sure that our system knows where to get the Elastic Stack components from. It also ensures that our machine can reach the repository sites necessary for step 6.
sudo yum clean all
followed by
sudo yum makecache
Step 6 - install Elasticsearch
Did someone say please start already? - ok here we go - install Elasticsearch.
sudo yum -y install elasticsearch
Step 7 - wait. wait. wait until its installed. ok?
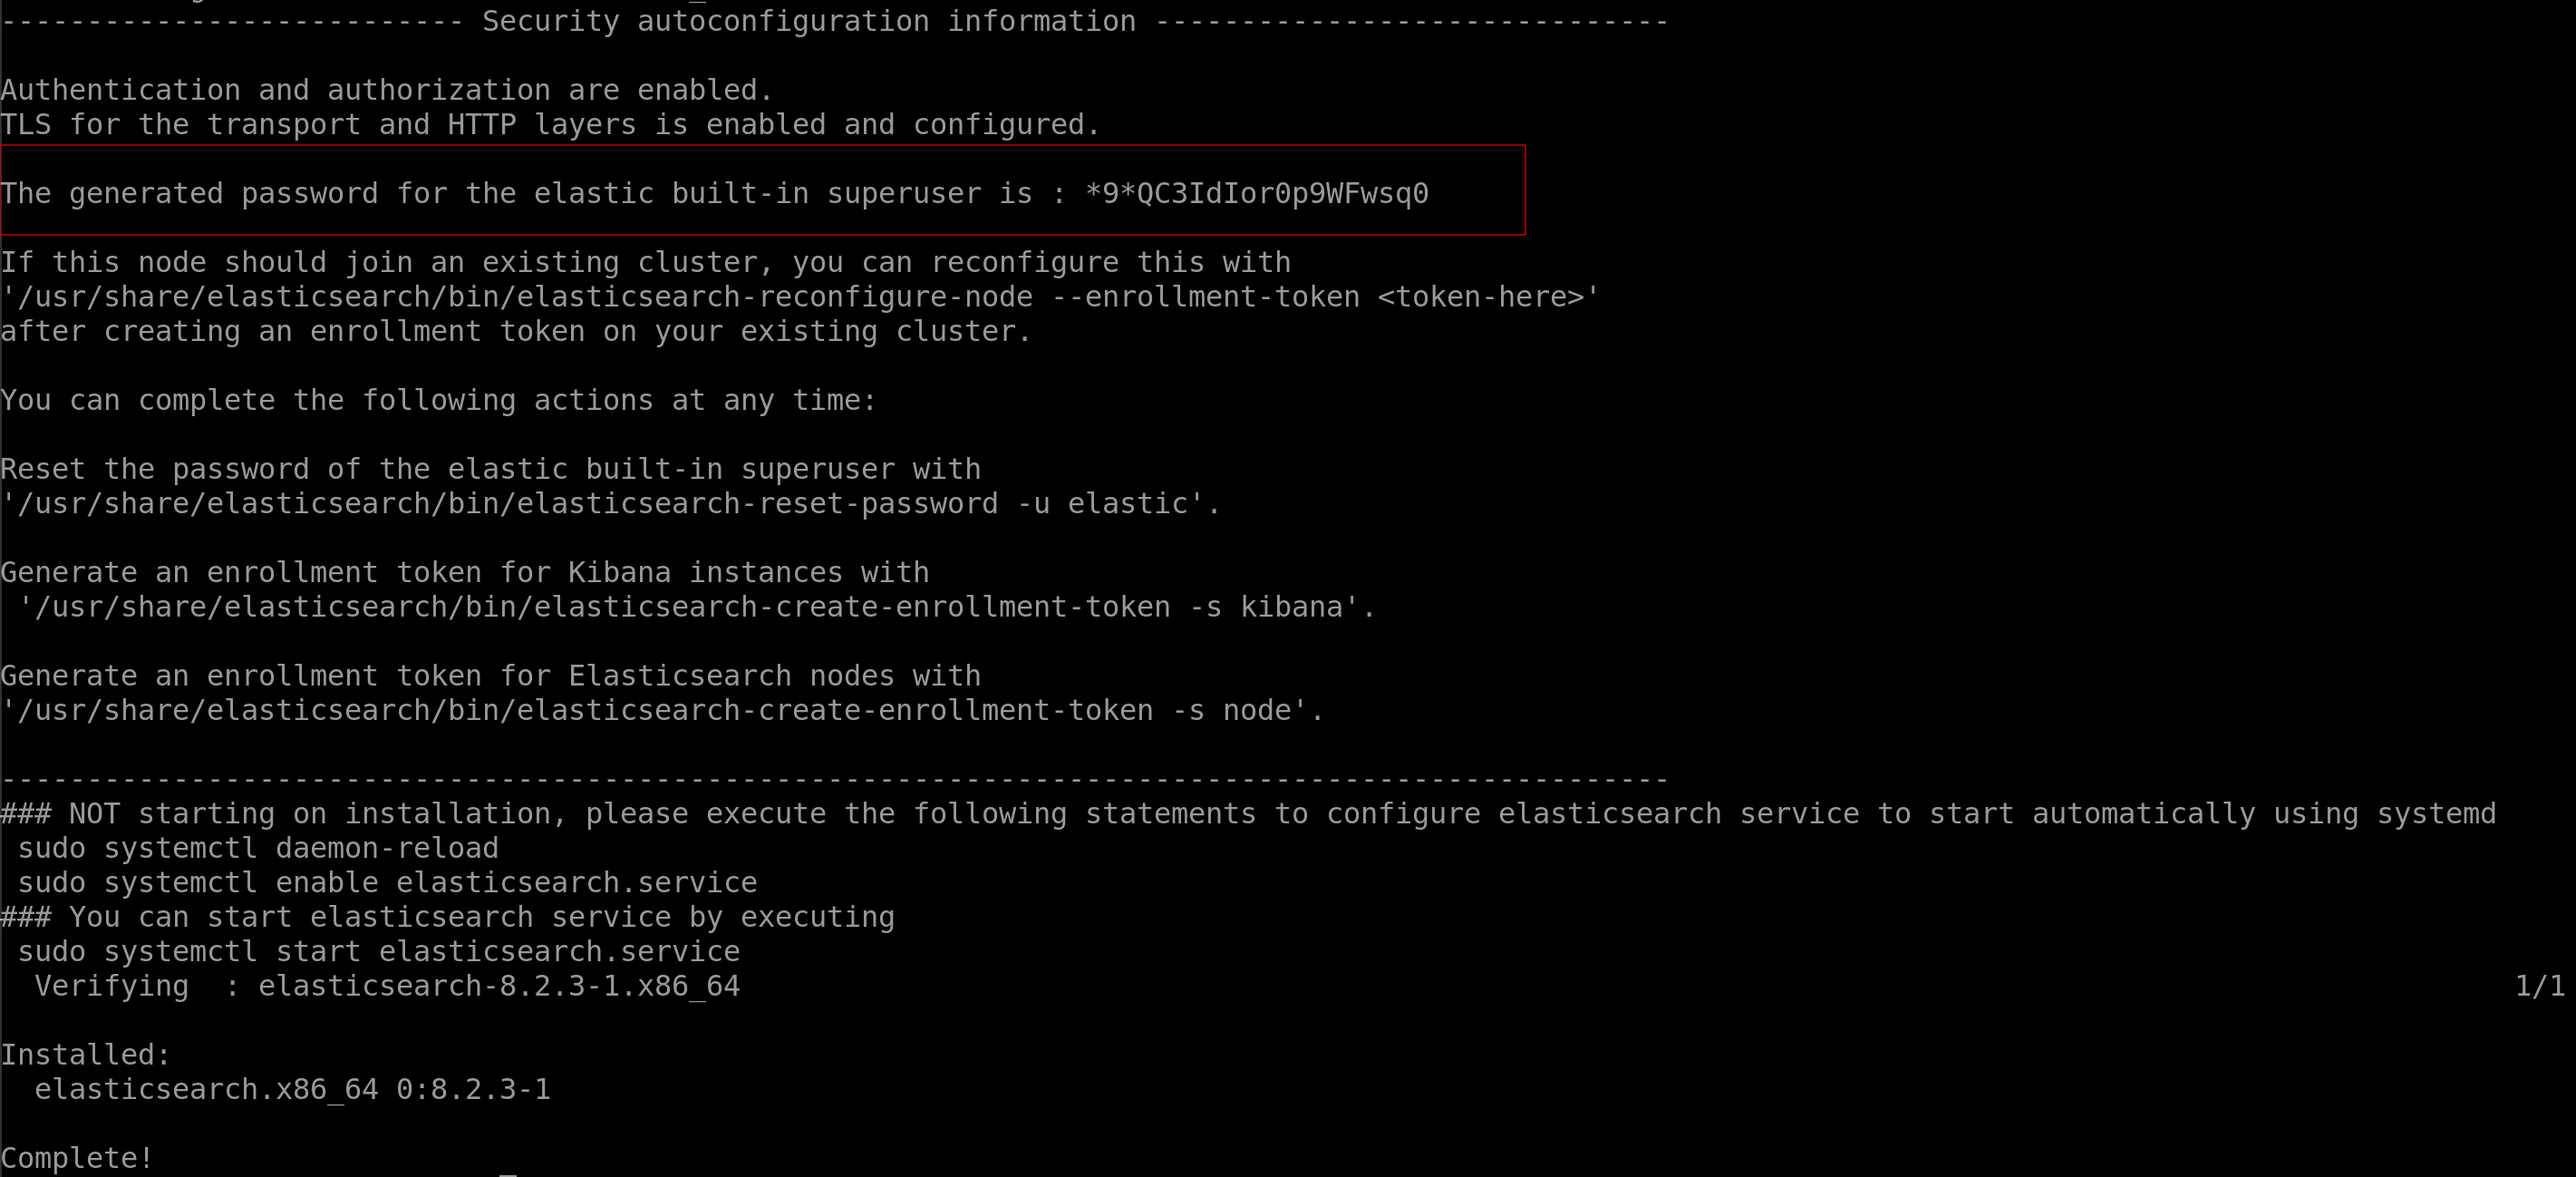
Once Elasticearch was downloaded and installed you should see output similar to the screenshot below - make sure to copy the elastic password and save it somewhere secure (you can reset the password later as well - and actually... since you want to install everything without security... why would you need a password?! spoiler - you don't.)
Step 8 - making sure it works
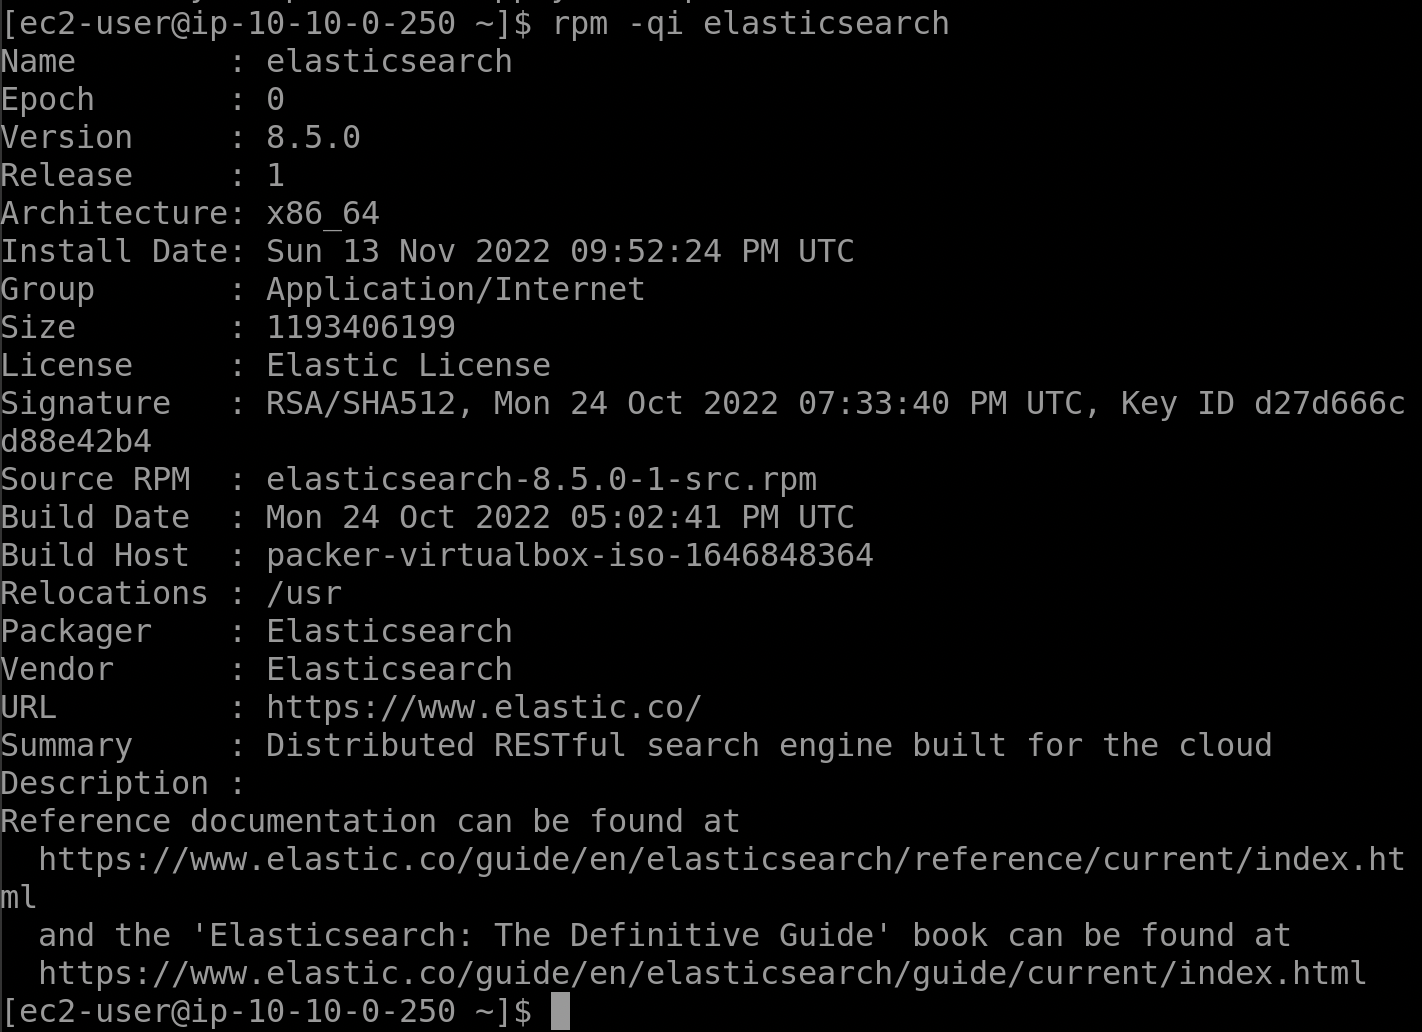
Make sure that everything worked out by running
rpm -qi elasticsearch
which should give a similar output to this one
Half-way time
Wonderful, everything worked out exactly as we planned. If only this thing were running already, we could search for everything! (almost).
Conceptually, we now need to enable the Elasticsearch service and configure it to not use the security features that come per default since version 8.
disable the security features & change the configuration
Since you are still reading I assume you either know what you are doing, just want it to work because everything else failed, or you are a rebel. I like rebels.
You can use any editor and change the /etc/elasticsearch/elasticsearch.yml.
sudo nano /etc/elasticsearch/elasticsearch.yml
change the lines network.host, http.port and discovery.seed_hosts to the following:
network.host: 0.0.0.0

http.port: 9200

discovery.seed_hosts: []
You might need to remove the pound-signs/hashtags at the beginning of each line.
If you want to understand what exactly we are doing: We set the network host to allow access from any IP (0.0.0.0), set the Elasticsearch port to 9200 and clear the hosts (because currently there are none and there will be only one in this setup)
Last but not least look for the following line:
xpack.security.enabled: true
and make that
xpack.security.enabled: false
This disables the default security features (e.g. https and password/token-based authentication) and lets us use http (unencrypted) communication because we are lazy and don't like certificates.
enable and restart the Elasticsearch service
sudo systemctl enable --now elasticsearch.service
sudo systemctl restart elasticsearch.service
ITS ALIVE
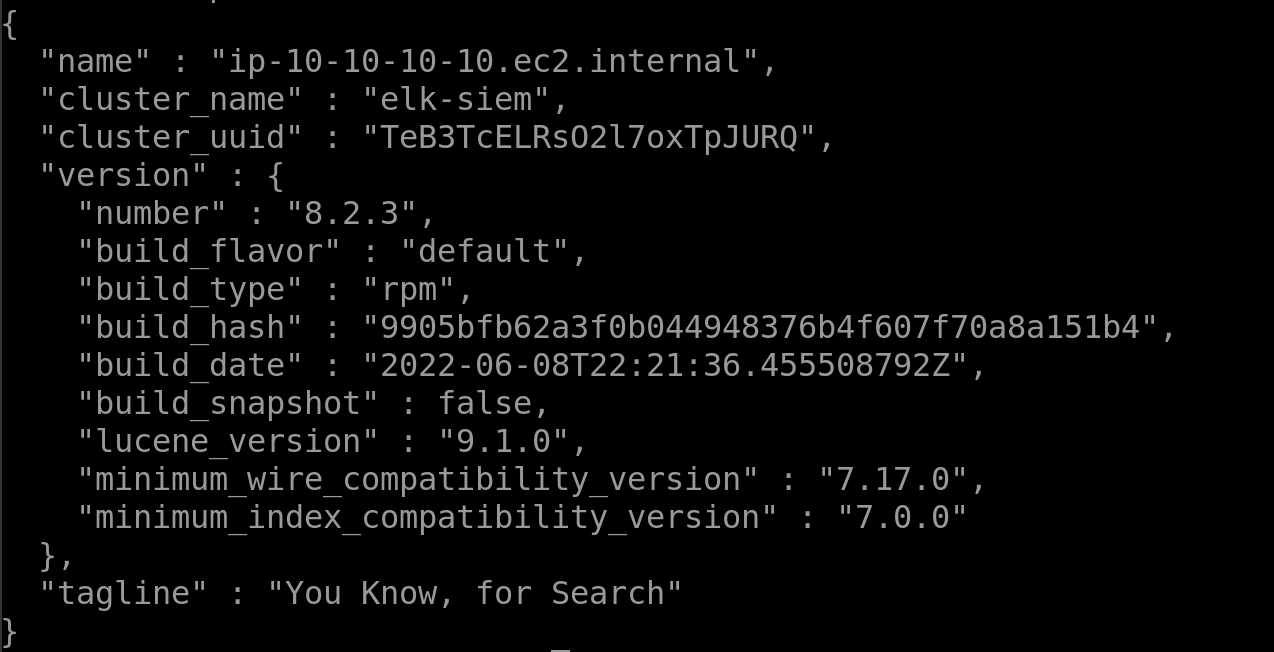
If everything worked you should be able to test that everything is well via:
curl http://127.0.0.1:9200
and be greeted with similar output
if for some reason this gives you an error / empty response make sure that elastic is running
systemctl status elasticsearch.service
In an ideal world it would look like this:
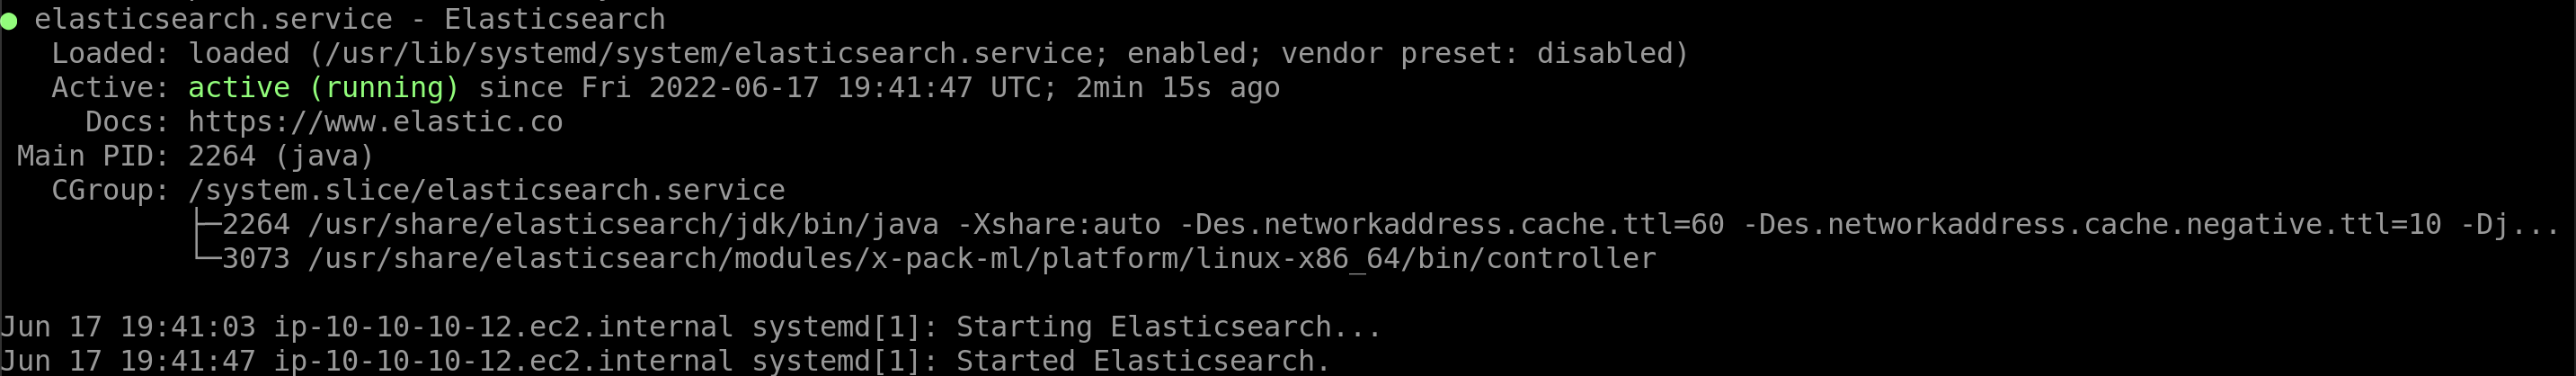
If the output is "inactive" try restarting the service manually and curl again
sudo systemctl stop elasticsearch.service
followed by
sudo systemctl start elasticsearch.service
Should all of this not lead to the expected result you can try to check the logs to see if you can pinpoint errors.
journalctl -xe
Kibana
Since Kibana is part of the elastic repositories we added earlier we can directly install it.
sudo yum -y install kibana
enabling the service
As with Elasticsearch we also need to enable the Kibana service so that it runs after reboot.
sudo systemctl enable --now kibana
configuring Kibana
Kibana needs to know which port it should run on (default is 5601), which Elasticsearch server it should connect to (we... well we have only 1 machine for everything currently, so probably that one as well).
Remove the pound-sign/hashtag and change the following lines in the /etc/kibana/kibana.yml:
server.port: 5601

server.host: "0.0.0.0"

server.publicBaseUrl: "http://<your_server_ip_goes_here>:5601"

elasticsearch.hosts: ["http://127.0.0.1:9200"]
The first line tells Kibana to use its default port 5601. The next one defines who can access the Kibana instance (0.0.0.0 is everyone or the whole internet). The Server public base url is the address that you want to reach the Kibana server at. It is usually the IP of your Kibana server plus the port at the end. The last line tells Kibana where to look for the Elasticsearch server. In our case this would be the loopback address of our localhost.
(re)starting Kibana and testing everything
Once all of the steps above have been done you can restart Kibana, check if it is active and start collecting logs. We can achieve that with commands we already know:
sudo systemctl restart kibana

systemctl status kibana
If Kibana is active we should be able to open a web browser now... but where?!
We need one more instance that actually we can collect logs from. We also might be interested to see the dashboard so let us catch two fish with one net.
We add a Windows Server 2019 or 2022 machine to our Snaplabs Network with 4GB RAM and 40GB disk space. Make sure that this one is in the same subnet.
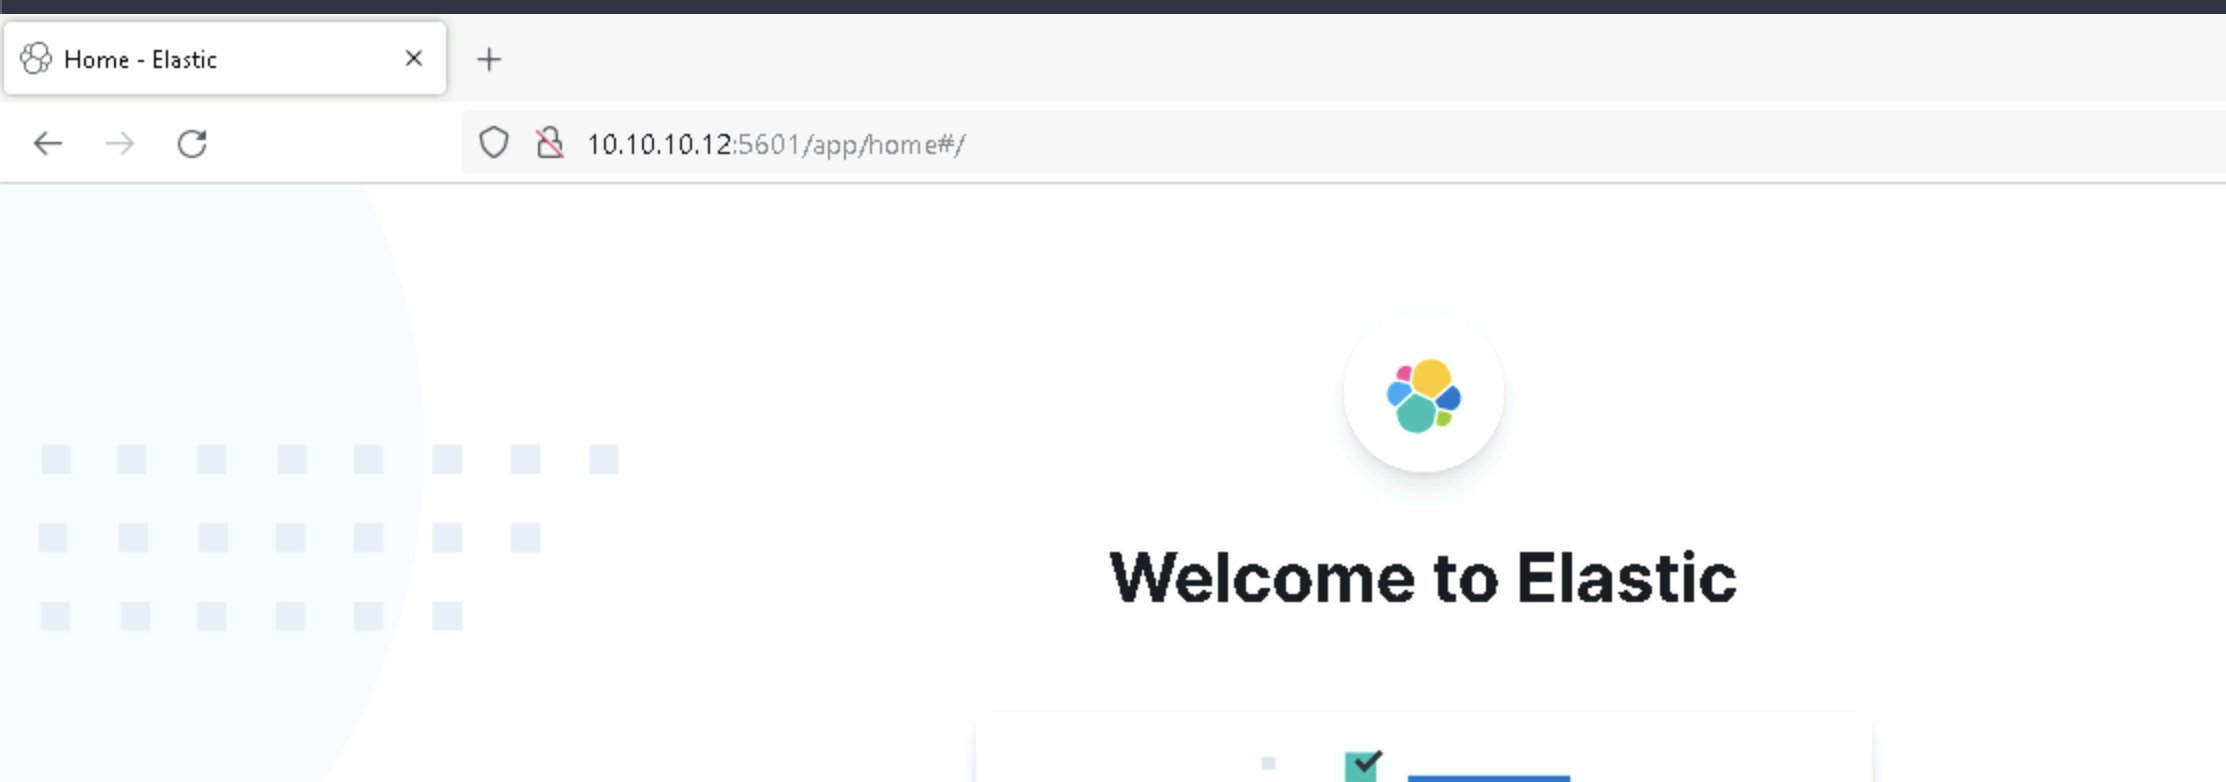
Now you can open a browser and type:
http://<your-kibana-server-ip-here>:5601
and you should be greeted with the Kibana dashboard that looks like this:
Winlogbeat
Winlogbeat will connect our windows machine to the Elasticsearch + Kibana server. It lets us see pretty graphs in Kibana as well, so lets install it already.
go check out: https://www.elastic.co/guide/en/beats/winlogbeat/current/winlogbeat-installation-configuration.html
for a detailed walkthrough or follow me for the visual version.
First you download winlogbeat on your windows machine (https://www.elastic.co/downloads/beats/winlogbeat)
Next you unzip it. After that you move the (inner) folder to C:\Program Files\winlogbeat. Now edit the winlogbeat.yml:
setup.kibana:
  host: "<your-kibana-server-ip-goes-here>:5601"

output.elasticsearch:
  hosts: ["<your-elastic-server-ip-goes-here>:9200"]
Save the file. Finally, do the following:
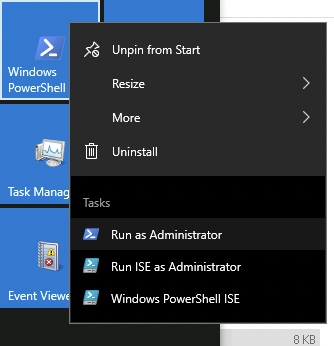
open Powershell as an administrator (either login as Admin or right-click the powershell icon and click "Run as Administrator"
navigate to the winlogbeat folder
cd 'C:\Program Files\winlogbeat'
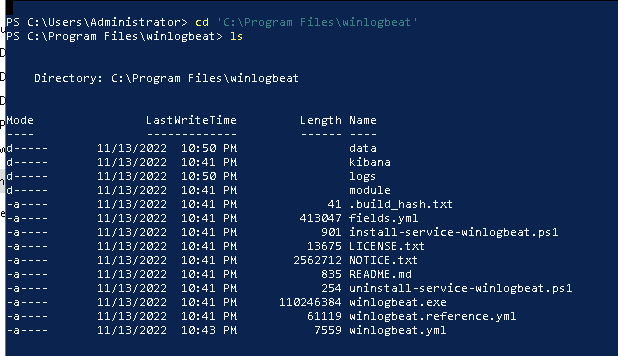
and run:
. .\install-service-winlogbeat.ps1
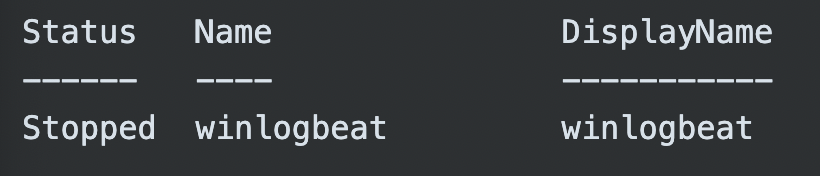
This will throw a Security warning at you which you can read!!! and then decide to click the "R" button followed by enter, which will run the script once. After that you will see that the status of your newly installed winlogbeat service is "Stopped".
HUH?! WHY YOU NO START Mr. Service?!
I shall help you with that.
We setup winlogbeat with:
.\winlogbeat.exe setup -e
and then start the service with
Start-Service winlogbeat
now you can check if the service is running by using
services.msc
scrolling down the list to "w" and finding your service as "running".
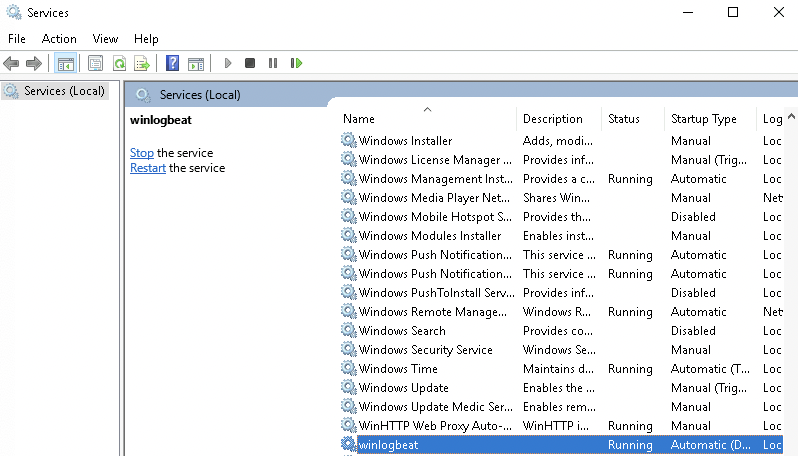
You can always start the service from the service menu by right-clicking winlogbeat and then selecting "Start" or "Restart" if it is not working.
Winlogbeat Dashboards
Open a Browser on the Windows Cloud machine and navigate to Kibana (your elastic ip + port 5601). Next click on the menu at the top left and select Dashboard.
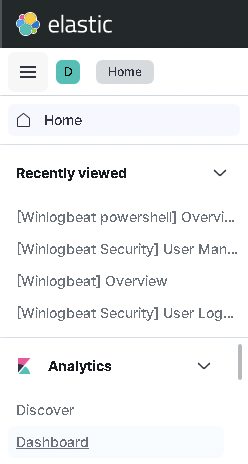
You should see [Winlogbeat Security] Dashboards at the top now if everything worked.
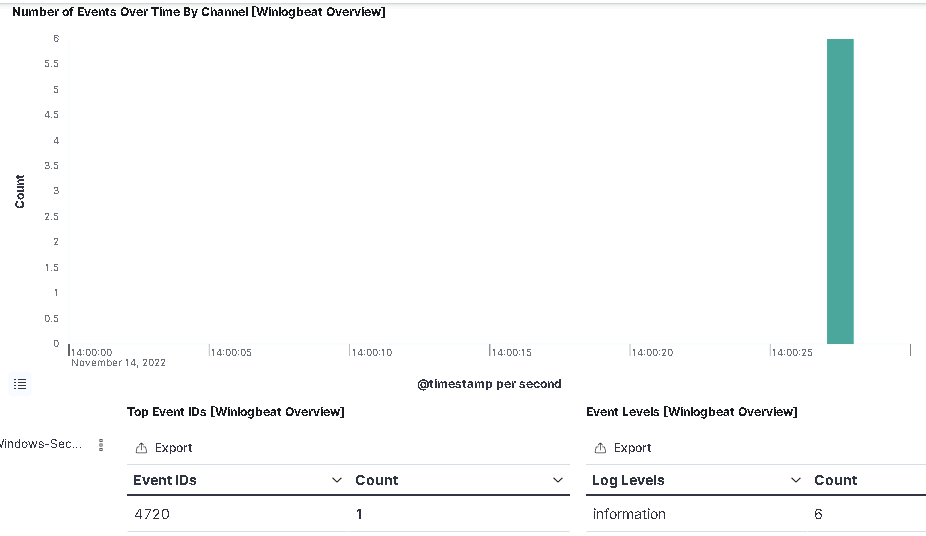
Select the "[Winlogbeat] Overview" dashboard and stare in awe for a couple of minutes. You have real live events coming in here - WAOW! If you for example add a new user on the windows machine
net user maikroservice Th15isMyP4$$w0rd! /add
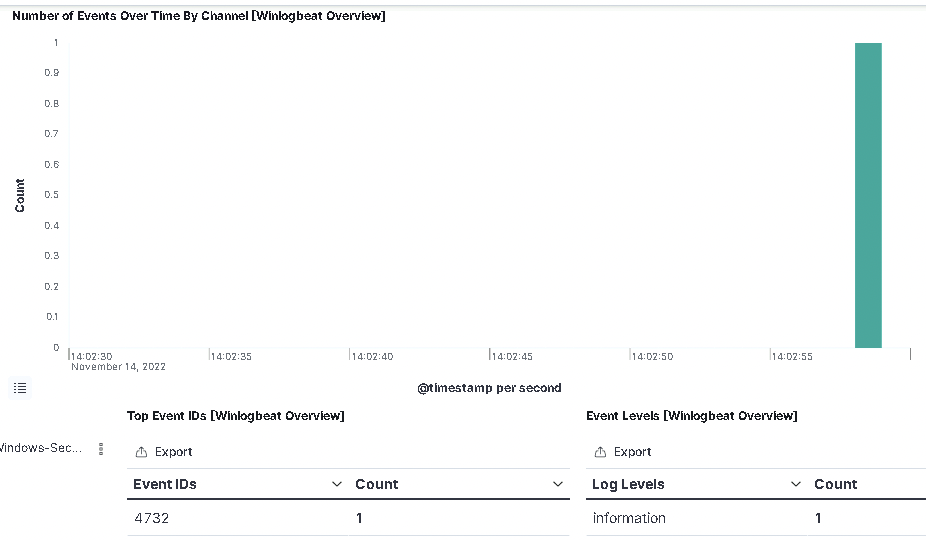
and then make that user a local administrator
net localgroup administrators maikroservice /add
You should see a couple of events shortly after in your Kibana.
First will be a 4720 - user created.
And next will be a 4732 - User added to Privileged Group
You can filter the time shown at the top right.
If you want to learn more about Windows Event IDs check out: https://www.ultimatewindowssecurity.com/securitylog/encyclopedia/
or follow me on twitter (https://twitter.com/maikroservice) for Threads about Security Topics.
I hope you learned something today - this was an awesome experience for me.
Next up - Securing your CloudLab Monitoring
I recommend you check out https://maikroservice.com next week, because we will update the security of our elastic installation. First with username/password based authentication.
- Ultimately, with token based authentication!
Stay tuned and keep learning.